Thursday, December 15, 2016

Costly Council Apron Strings

Here I am standing at the end of my Devonport street. I'm on the "apron" of the "T-intersection". It was relaid in hot mix by Council contractors about a month ago. Maintenance I guess.Took them several days. Between 10 and 15 high-vis clothed men on site. Lots of technology. Utes and about a hundred witches hats.

I'd driven over it for a few years and hadn't seen any problem with it. But I've learned that's often the case.

That's not my beef here.


These cones are still outside my front gate. I have phoned Council's hotline. They assure me they will be taken away in 10 working days. So it's likely they'll be gone by Christmas. They make the street a bit Christmasy though don't you think?

That's not my beef here either. (Nor is it with my neighbour across the street  hard at work, or his cat, or with the boat - this is Devonport after all.)
Between 1998 and 2004 I was Chair/Deputy Chair of North Shore City Council's Works and Environment Committee, and also on the Devonport Community Board. Street maintenance works like this apron were routinely done then too. A wise councillor told me then that anything the council did - road maintenance, mowing of lawns, sewer pipe repairs for example - would cost double what it would cost done by the private sector. Over time I came to understand why that was.

Public money and public assets on public land are different beasts to manage compared with what happens on private land with private infrastructure. There is consultation with local residents about timing, there is a need for annual budget planning that has to be consulted and agreed, and then, there was even consultation about whether the apron would be done in hot mix or chip seal.

But it's different again, and far more costly today, and you won't see an elected representative anywhere near the work. They are not involved anymore. They don't know what's happening in the urban environment where they have been elected to represent community interests. They're not there to watch over the wise use of ratepayer funds.

Council amalgamation and remote, arms length Council Controlled Organisations, are all part of the regional institutional change that is at the root of what is leading major local cultural change.

In the bad old days there were several "small contractors" who did this sort of road maintenance. Locally based operations, overseen by a local Council area manager. Usually the road section would be closed while it happened. Notices would advise of this, and residents would take slightly longer to get from "A" to "B". So there was no need for hundred of witches hats - but more importantly - there was no need for several men to be paid to direct the desultory traffic movements that happen in the back-blocks of Devonport. It was much cheaper.

I can hear the moans and complaints this posting will cause in AT (Auckland Transport) from here. They will say the work is being done to a higher standard. They will say that Devonport residents are being less disturbed by the work. They will say there are fewer safety risks. And most of that might be true. But that isn't the issue.

Not everybody is interested in the maintenance of their pipes, roads, libraries and parks. But you'd be surprised how many are. (One of my long standing memories visiting my daughter in Sapporo Japan, was to see that road works and pipe works were done by local pensioners and neighbours chatted with them on the way to the shops.) There is just a little more alienation of community involvement that happens when shared assets are maintained and managed remotely. A little more atomisation and separation. An emphasis on private lives. A loss of opportunity for community engagement. And at increased cost as well! Talk about a lose-lose outcome.

We are steadily losing through amalgamation parts of the institutional fabric that I associate with life and social development in New Zealand towns - socially connected urban communities.

Running On Empty

A few weeks ago I did the Alps to Oamaru cycle adventure, on part of John Key’s legacy cycleway infrastructure network. Rightly praised and highly popular. You can see a GoPro video I made about it here.

The best part was from Mt Cook to Lake Waitaki – through the McKenzie Country. But the rest of it is a downhill experience as the effects of another one of John Key’s legacy projects gets up your nose.

Intensive dairy farming enabled by central government assisted and encouraged irrigation, more than gets up your nose though. Through Kurow, Duntroon and Ngapara we cycled through cow pats and sheep manure and gear shift mechanisms got so clogged I had to poke the shit off.

Being an Oamaru boy, at Waikaki Boys High School, this landscape was my backyard. And later when I attended Canterbury University, my backyard extended to include much of the Canterbury Plains.

We had a family crib (bach) at Gemmell’s Crossing on the Kakanui River 8 miles from home. Even in the hottest summer you could jump off the bridge, or a willow tree rope swing. The river was deep, wide, clear, fast-flowing and glorious. Dad was a keen fly-fisherman.

Now it’s buggered.

Too much water being taken out of it, and from bores sucking down its feeder aquifers. For irrigation.

The soils that have naturally developed in the normally semi-arid climate (600mm of rain in an average year) don’t hold much water. Any extra goes through, some runs off on the underlying clays, some into the water table, and the rest into aquifers. That was when it did rain. Now centrally-pivoting irrigators have taken over. Inevitably, to get the grass growth needed, much of the land is over-irrigated.

So now any dissolved nitrates or any other chemicals or fertilisers, get washed into the river or into the aquifers. It’s not rain anymore that wets the ground and replenishes the groundwaters. It’s irrigation. And it’s washing through what clogged up my bike gears. Which is why what water we do see today in the Kakanui is green and weed-filled. Most people in New Zealand don’t know about the Kakanui River. More know about what’s happening to rivers in the Canterbury Plains.

Here’s some remarkable photo essays that Stuff has run recently on Canterbury’s braided Ashley and Selwyn Rivers.Community Mourns its Lost River; Selwyn is polluted and running dry; Trout get free ride to deeper water; 60% drop in river flow.

I talked to a Fish and Game Executive member about what’s happening. He’s angry of course. One thing he told me explains attitudes.

Apparently New Zealand’s Primary Industries Minister was in South Canterbury, talking to farmers. His memorable quote, when he talked about the rivers?

“Every drop that gets to the sea is water wasted….”

That’s the attitude of most - but not all - farmers. Seems to be the attitude of government Ministers.

The Minister of Environment writes: “good science and not slogans are at the heart of decision-making…” He’s grumpy at Fish and Game. He argues: “making every river swimmable is ‘not practical’…” And on Hastings and Havelock North: there’s “…’no evidence’ of dairy linked to gastro…”

Yet these are ministers in a government that sacked ECan Regional Councillors who, under advice from their water quality scientists, moved to restrict water-take permits in Canterbury for more dairy farming because of modelled nitrate pollution risks.

Seems like there’s science we like, and science we don’t.

Did you know that Fonterra gives itself a GST holiday on a proportion of the milk it buys from cooperative farmers? Payments for that milk are treated instead as a dividend and don’t generate GST revenues for central government. This is a subsidy to Fonterra farmers.

Nevertheless, in terms of central government revenues, Fonterra’s annual turnover (2015 year) of $18.8 bn (equivalent to almost a third of NZ government’s annual tax revenues) resulted in around $500 million in total tax payments (compare - by the way - with the $2.8bn GST collected annually from tourists). However these fiscal numbers don’t account for the total cost to New Zealand, or to the rest of the world for that matter, of the focus our country has on dairy farming.

Action photo of me at start of A2O taken by Emily Cayford

If you looked at my A2O video you will have seen the quality and clarity of rivers in Central Otago close to their source. Hard to value the losses that are being caused by dairy intensification.

The bald Fonterra numbers exclude or conceal externalities - external costs such as:
  • Loss of fresh water area and amenity for local population recreation (swimming, boating and fishing) 
  • Loss of biomass and diversity of freshwater ecosystems (eels and trout are at the end of a complex food-chain) 
  • Loss of cultural and geographical landscapes for regional parks, tourist attractions, and which are reminders of what physically shaped our human history and character
  • Loss of future tourist revenues - who wants to look at or bike through dairy factory farming?
  • Loss of dry-weather resilience because of reduced water volumes stored in underground aquifers 
  • Loss of global economic resilience because of focus and reliance on mono-culture agriculture 
  • Loss of rainforest land in Malaysia and Indonesia. Over 1.5 million hectares of palm plantations were planted to meet typical annual New Zealand imports of Palm Kernel processing products to supplement the pasture feed of the country’s dairy herd (2008 data). 
 (By the way, for a few Dairy facts and figures.)

Whose water is it anyway – especially the underground water? And whose landscape is it – particularly outstanding landscapes that intensive irrigation will change forever?

This is not a natural disturbance. Like an earthquake.

It is a disturbance borne of short-term economic planning which is slowly destroying what could be termed a kiwi birthright, core kiwi values, the essence of New Zealand. The institutions that enable this disturbance know their economic livelihoods, and of everyone who works for them, depend on the disturbance continuing, and understand it is part of their role to minimize and dismiss and deflect concern and criticism.

Fonterra, Dairy New Zealand, and Government Ministers all share this responsibility.

How long will New Zealanders let them get away with it – that is the question?

(Stop Press: Some are doing something about this now. You can read a useful article about what's happening in the McKenzie country in the current issue of the Listener magazine. And EDS - Environmental Defence Society - is mounting a legal challenge to the irrigation and land use changes that are happening. They are in court this month and need financial support. EDS were successful in a similar King Salmon challenge relating to aquaculture in the Marlborough Sounds. They are an effective organisation. I suggest you make a donation. Go here.)

Leviathan Part 1: Auckland

A different analysis of the social, political, economic and cultural forces shaping the western world is emerging post the 2008 "Global Financial Crisis" - a crisis which many have interpreted as the sign of a major cross-road in the progress of the neo-liberal project that economic efficiency requires a free market. This different analysis was developing in the USA before neo-liberalism really took off under Reagan, was dormant for a time, but is now coming back into focus to help explain Trump, Brexit and other similar behaviours and outcomes. Important writers include Galbraith, Weber, James Burnham, Samuel T. Francis and Jerry Woodruff. Hardly household names. Especially not here in New Zealand.

To kick this post off, a summary of the analysis is this: a new ruling social group has been developing over the past fifty years in the West. This is an increasingly powerful class of skilled professionals who are at the heart of and who guide the operations of an expansion of government power and bureaucracy, and the widespread emergence of mass organisations. It is argued that this is a change from times when a greater proportion of government and public functions were de-centralised, smaller and local, and where more economic activity was concentrated in the hands of private entrepreneurs, their families, and local communities.

It is argued that this increasingly influential and affluent social grouping has emerged as a managerial elite which is steadily displacing social and political institutions that had existed to reinforce and protect the interests of the large group of society who now feel increasingly alienated and by-passed. This managerial elite is remaking society by substituting its new world outlook.

But I get ahead of myself with such a summary. In this post I would like to briefly explore what this analysis has to say about Auckland today - especially since amalgamation - and the creation of a mass organisation (Auckland Council) whose form, function and behaviour, is so well analysed and anticipated.

Mass Organisation and Loss of Owner (Ratepayer) Control 

It is useful to note that the writers listed above are not easily dismissed as "left" or "right" in their views. So don't be put off by the fact that the early pages of texts examining the social changes I discuss here usually begin with a bit of Karl Marx and Adam Smith. For example, Samuel Francis writes:
Both Smith and Marx, contemplating the rudimentary forms of corporations of their time, perceived a natural conflict of interest between the owners or stockholders of a corporation and its managers. The owners are interested primarily in a profitable return on their investment, measured in the increased yield in their dividend. The managers, on the other hand, are interested in the wellbeing and particularly in the growth of the corporation itself, and they typically desire not to pay out higher yields to the owners but to reinvest corporate profits in an increased capacity for greater output and enlargement of facilities and operations. (Pg 22, Leviathan and its Enemies, Samuel T Francis)  

For "owner and stockholder" read "ratepayer", for "corporation" read "council", for "return on investment" read "minimise rates for essential public services".

In this next section, quoted from a few pages later, as Francis develops his argument, I have only swapped "Council" for "corporation", and "ratepayer" for "owner". You will get the picture:
...the dispersion of the mass of ratepayers, who lack the opportunity, the interest, or the ability to coordinate their voting power, tends to prevent most effective challenges to those who possess the skills to operate and direct the Council. But the decisive cause of the loss of control by the ratepayers to the managers is the sheer size, complexity, and technicality of the mass organisation and its activities. Whatever the legal rights of ratepayers.... they cannot... acquire the specialised technical skills that management of the mass organisation involves...(Pg 25, Leviathan and its Enemies, Samuel T Francis)

And here we could just as easily substitute "elected councillors" for "ratepayers", because councillors are the ratepayers' representatives in "control" of Auckland Council. The main thrust of this analysis is the problem presented to ratepayers and their representatives in any attempt to challenge or to control Auckland Council. Frances continues (and no swapping is needed):
Like the corporation, the mass state undertakes a wide range of diverse and highly technical activities in the economy, society, science and communications, in addition to its purely administrative and political functions. The latter also become increasingly specialised, technical and complex to the point where today academic degrees and entire schools of public administration exist and flourish.... in the state sector of mass society and in the mass corporation, actual power is distributed according to managerial skills and not by a formal equality of rights and votes or by legal ownership.  (Pg 45 and 47, Leviathan and its Enemies, Samuel T Francis) 
Another plank in the analysis is the relationship that exists between the mass state organisation and large private corporations. The myth of public and private separation is well and truly dismissed:
Mass organisations in the economy cannot operate - they cannot plan for mass production, financing, research, and marketing - without the cooperation of the state, and this cooperation serves the interests of the managerial elite in the state, since its role in the economy extends its power and functions. Thus the managerial elites of the mass corporations and the mass state do not resist, and, indeed, collaborate to promote, the fusion of the mass economy and the mass state.  (Pg 63, Leviathan and its Enemies, Samuel T Francis)

Nowhere do we see the truth of this more clearly than what is happening here in Auckland between the growth economy and Auckland Council with population growth and mass housing development, and where the "owners" of Auckland - existing ratepayers - have no control of their own environment, let alone Council managers in charge of enabling and facilitating this social transformation. (I suggest it is also evident between central government and the Fonterra Corporation; and between the emergency state in Christchurch and Fletcher Corporation - but those are other stories.)

I'll end this post with a brief account of another conceptual idea that is explored in this analysis of the massing of western society, and which is relevant to Auckland because of its size and growth. Mass state organisations (and mass corporations) act to break down social differentiations that impede or restrict mass production and mass consumption. A clear example of this in Auckland has been the replacement of a set of diverse District Plans, with a single Unitary Plan which envisages just 3 or 4 types of urban housing settlement. The main advocates for this simplification were from the property development economy. For them the diversity in planning across Auckland and the different housing and street typologies that have resulted in Devonport, Ponsonby, Waitakere, Albany, Freemans Bay, Flat Bush and Parnell for example, was intolerable. A more homogeneous system of urban planning was required. Distinct and local Community Board arms of the state were also intolerable, when viewed from the perspective of the professional management class, whose sophisticated and highly educated submissions easily trumped the local interest arguments mounted by those clinging to community and a particular and kiwi way of life.

The question then. Are you part of the problem, or part of the solution?

A High Sea in Auckland

This year I gave students a lecture about sea level and storm surge plannning in New Zealand. This was partly informed by the Parliamentary Commissioner for Environment's report Rising Seas: Certainty and Uncertainty. It was also informed by the recent South Dunedin flooding incident, and a lesser known one that affected Auckland on a fine Sunday, 23 January 2011.

At the time I took a few pictures in Devonport, and did a post about it.

The urban policy course provided an opportunity to talk with students about the various factors in play that day that caused the kind of coastal inundation recorded in the photos. Students explored various datasets, most of which are readily available.

First off all they checked out weatheronline for rainfall. It's available there for free for Auckland Airport. You can see that it did rain on the 23rd of January - but not a lot - about 15mm. It rained much more heavily around the 28th January, but there was no coastal flooding.
You can find this comprehensive weather information from timeanddate.com. At the bottom are the wind speeds and directions. Unusually the winds are strong South Easterlies until mid-day, around 33 kph. They would have been blowing straight up Waitemata Harbour (but they were also doing that the day before).
This one also come from weatheronline. It shows the atmospheric air pressure over Auckland. You can see that on the Sunday in question it dropped to 995 hectopascals. That's quite low, and has the effect of lifting sea levels, because higher pressures elsewhere push the sea down there, pushing it up where air pressure is lower.
And this is the really interesting graph students wre able to produce from Ports of Auckland tidal charts provided by POAL for the purpose of this course. This graph shows the sea levels at POAL wharves in Waitemata Harbour for the month of January, 2011. There are two high tides (and two low tides) each 24 hours. The sea level recorded at 23rd January is 4.129 metres - and you can see that the "normal" tidal level around that time was about 3.6 metres - a typical peak high tide level in a month.

Thus the sea level in Auckland's Waitemata Harbour was half a metre higher than normal on the 23rd of January 2011. What was the main cause?

Was it the rainfall? If you look at the rainfall graph you will note that heavy rain fell on the 28th January, but the sea level on the 28th January (counting 10 peaks after 23rd January peak) was only 3.1 metres. So, almost certainly not.

Was it the wind? There were strong winds the day before - but not as strong. So the wind would certainly have contributed, by pushing the sea up Waitemata Harbour.

Was it low air pressure? Check out the PCE's report for the physics of this. That report confirms the direct relationship that exists between low air pressure, and elevated sea levels. Often called a "storm surge". This is the name given to elevated sea levels in a storm where winds circulate around an area of low air pressure.

Big storms are associated with very low air pressure, and very elevated sea levels. Hurricane Katrina elevated the sea level at New Orleans by 7 metres. Hurricane Sandy elevated the sea level at New York by 2 metres. The storm that sunk the Wahine in 1968 was recorded as a low pressure weather system of 970 hectopascals (the lowest recorded around NZ) which elevated the sea level at Ports of Tauranga by 88 centimetres and caused widespread coastal flooding - quite apart from sinking the Wahine.

Tropical storm systems are moving further and further south with climate change, and the frequency of their arrival offshore of New Zealand is increasing. It is only a matter of time before air pressure and winds combine to increase the sea level in Auckland's Waitemata Harbour a metre above normal high tide.
Are we ready, what's the plan, and how much warning would we have?

How Fast are Tsunami Waves?

Like with earthquakes, despite being a physics nerd, it wasn’t until one happened where I lived, that I got interested in them, and wanted to understand them.

For example, let’s just say there had been a big shake 20 kilometres offshore from Kaikoura*. One that caused a chunky land uplift deep under the sea. How long would it take for the resulting tsunami wave to reach the coast if the depth of water was 1500 feet on average (500 metres)?

The physics is well understood. A tsunami wave is not like a surface wave caused by wind. It gets its energy because of the enormous pressures that exist deep under the sea. 

Tsunami wave speed = Square root (Water depth x Gravity)
                                = Sqrt (500 x 10)   (Gravity is more accurately 9.8 metres/second/second.)
                                = Sqrt (5000)   (approx)
                                = 70 metres/second    (approx)
                               = 250 kilometres/hour.   (roughly - the deeper the water, the faster the wave)

So it would take the first tsunami wave less than 5 minutes to hit the Kaikoura shoreline.  (In an earthquake there are usually several waves produced **). 5 minutes is a very short time, and if the average depth was 1000 metres the wave would take just over 3 minutes to hit.

That’s why it’s important to get tsunami warning systems right.

Otherwise they are useless.

* The Kaikoura Canyon is a submarine canyon situated 500 metres off the coast to the south-east of the Kaikoura peninsula. It is 60 km long, up to 1200 m deep, and is generally U-shaped. It is an active canyon that merges into a deep-ocean channel system that meanders for hundreds of kilometres across the deep ocean floor.
** You will have seen video footage of tsunami, and seen that they don't come ashore at anything like 250 kph. In fact they come ashore at more like 20 to 30 kph. So what happens? As the sea depth close to land gets shallower, tsunami waves that have been travelling at 100s of kilometres/hour and a hundred kilometres peak to peak only a metre high, get higher and closer and slower, as the energy of the deep water gets pushed up by the sloping sea floor. This is termed the "run up" phase.     

What happened at Fukishima, Japan? 

On March 11, 2011, at 2:46 p.m. local time (05:46 Universal Time, or UTC), a magnitude 9.0 earthquake struck off the east coast of Japan. The epicenter was 130 kilometers (80 miles) east of the inland city of Sendai, and 373 kilometers (231 miles) northeast of Tokyo. The earthquake took place around 67 km (42 mi) from the nearest point on Japan's coastline, and initial estimates indicated the tsunami would have taken 10 to 30 minutes to reach the areas first affected, and then areas farther north and south based on the geography of the coastline.

According to the Japan Meteorological Agency there were only about 4 minutes between the earthquake and the initial tsunami arrival at the observation buoy just off the coast of Kamaishi. Assuming the estimated arrival time is correct (i.e. it took another 5 minutes for the wave to travel from the buoy to the coast) that would give them somewhere between 9 to 24 minutes between the earthquake and the arrival of the first tsunami at the closest points and various points north and south.

One minute before the earthquake was felt in Tokyo, Japan’s Earthquake Early Warning system, which includes more than 1,000 seismometers, sent out warnings of impending strong shaking to millions. It is believed that the early warning by the Japan Meteorological Agency (JMA) saved many lives. The warning for the general public was delivered about 8 seconds after the first P wave was detected, or about 31 seconds after the earthquake occurred.

Assuming that the earthquake time reported is the time at which the JMA became aware that there was an earthquake occurring (most likely/logical time to report in my opinion), taking into consideration that it takes them at least 3 minutes to issue a forecast AND assuming that this time is when people in the affected areas actually receive the tsunami warning, it leaves only 6 to 21 minutes for people to register the warning, to take action, and to get to high ground. And that was for an earthquake that occurred 67 kilometres offshore.

If New Zealand had its act together in the same way Japan did - ie 3 minutes to figure out what was happening, decide, and issue a warning to the Kaikoura sirens - and if the first wave hit in between 3 and 5 minutes.... well, go figure...


This gives the heights of tsunami recorded around Japan's coastline. Dark red and bright red mark the highest waves, and the closest points to the epicentre.

And for some of those locations, here are the timings of arrival of the biggest tsunami waves, after the actual earthquake that triggered them:

On 13 March 2011, the Japan Meteorological Agency (JMA) published details of tsunami observations recorded around the coastline of Japan following the earthquake. These observations included tsunami maximum readings of over 3 m (9.8 ft) at the following locations and times on 11 March 2011, following the earthquake which remember was at 14:46 JST:

• 15:12 JST – off Kamaishi – 6.8 m (22 ft)   - (ie 26 minutes later with epicentre 67 kilometres away)
• 15:15 JST – Ōfunato – 3.2 m (10 ft) or higher
• 15:20 JST – Ishinomaki-shi Ayukawa – 3.3 m (11 ft) or higher
• 15:21 JST – Miyako – 4.0 m (13.1 ft) or higher
• 15:21 JST – Kamaishi – 4.1 m (13 ft) or higher
• 15:44 JST – Erimo-cho Shoya – 3.5 m (11 ft)
• 15:50 JST – Sōma – 7.3 m (24 ft) or higher
• 16:52 JST – Ōarai – 4.2 m (14 ft)

While the kiwi tsunami message of “If it’s long and strong, get gone” is a good one, we need to better educate our population and civil emergency people about what can happen, and we need better systems in place that the public can trust.

For example, I am aware that people living at Mangawhai Heads, at the top of the North Island, more than 10 metres above mean high water and more than 100 metres inland from the estuary, were woken by volunteers and told to move to higher ground after the Kaikoura earthquake which had occurred just after mid-night. They hadn’t heard the alarm either.

Otherwise it’s a bit like crying “wolf”.

New Broom at Auckland Council?

I was going to head this post "the first 100 days" (since the election on 8 October 2016) but that won't be until mid January. There have been some good signs - powerful calls for a regional fuel tax; a tourist levy; ATEED told to pull back from boxing promotion; no more wharf / port extensions; silence on a new city slogan. Good stuff.

However. The elephant in Auckland's room continues to be Auckland Council itself.

It keeps on growing.

Getting bigger. Employing more and more highly paid professionals. Consuming more and more resources in existing and accommodating its ever-expanding self, eating further into rate-payer dollars, becoming even less productive when measured against outcomes that matter to Auckland's residents.

The recent review of CCO (Council Controlled Organisation) letters of expectation presented one of the few opportunities that exist to councillors to reduce operating costs, and to begin reversing the growth of the elephant. Before reading on have a quick read of another of today's postings: "Levithan Part 1: Auckland" - which is the start of an analysis of mass organisation culture in New Zealand. An upcoming post will examine the relationship between Auckland Council's growth, Auckland City's population growth, immigration growth, and central government economic growth plans - and the inter-dependencies.

The Council report (to Tuesday's meeting - 13 December) that introduces the letters of expectation to CCO Chief Executive and their Boards tells Councillors this:
General messages for 2017-2018 
As council moves into the third term since amalgamation, there is a need to reset some of the expectations on the CCOs about their participation and commitment to a whole – of – group approach. This year’s draft LOEs therefore outline a number of general expectations, and send a strong signal that Council will be giving significantly more attention to the degree to which CCOs are delivering outcomes for Aucklanders. These expectations are set out below.
• CCOs need to take active steps to reinforce accountability to council. This will require strong leadership from Boards and chief executives, to build cultures and behaviours which recognise their organisations’ responsibilities to residents and ratepayers. Greater transparency in financial reporting is an important element of this. Additionally, CCOs need to work with council to develop new performance metrics which genuinely measure our success in achieving outcomes.
• CCOs need to align their operations with council strategies. A key plank of this is participation in development of the refreshed Auckland Plan.
• A stronger sense of collaboration in the council group is needed. This means collaborating across the other CCOs, and with council itself, to achieve group outcomes, and to maximise investment opportunities. As part of this, the shared services model and participation in group - wide policies remains important.
• CCOs should develop a stronger focus on customer service. One aspect of this is engaging more actively with Local Boards.

None of these expectations discusses the need to reduce spend, economise, to prioritise expenditure on infrastructure investments and maintainance ("outcomes" are not defined or differentiated). What these expectations do describe though, and require, are just the sorts of activities and tasks that professional middle managers love and can make a real meal of, and grow the elephant.

For example: "take active steps to reinforce accountability to Council". That means more internally focussed professionals, bean-counting, writing reports, being audited and checked. It also means more staff employed by CCOs to monitor goings-on-at-Council, checking the grape-vine, snooping at the rumour-mill, finding out who's saying what, and plotting and advising how to fix it. None of this is productive (as far as ratepayers are concerned) but it is deeply rewarding work for many professional managers (they love it). And in the same sentence being asked to "build cultures and behaviours". Man. What a great job that will be for highly qualified Business Administration experts and others with similar degrees and experience. And then there's "develop new performance metrics". Again, the science of mass organisation managerialism is summoned. How big a team will be required for this? And how much overseas consulting will be required? These are great jobs if you can get them. Look great on the CV. Passport to a senior role in MBIE I'm sure.

One that really tickles me is that "a stronger sense of collaboration in the council group is needed". Fat chance. The CCOs are at war with each other for the affections of Councillors and Council. Very senior managers spend a good chunk of their time in relationship management - but not relationships with "customers" - they are far more concerned about relationships with family members. Because it's all about affection, keeping in good with Council's CEO, not rocking the boat even fractionally with a noisy councillor, and at all times keeping heads below the parapet until you've got a really good story to crow about.

Which brings me to a CCO output that deserves as much attention as the proposed new Auckland slogan. Every CCO has a public relations and public affairs and public communications and relationship management function/team/office/budget. How about centralising that function Mr Mayor and Councillors. That would result in fewer highly paid communications managers, reduce costs in an area that is embarrassingly over-resourced and capable of inter-group conflict, and would be a positive way of implementing the expectation of a "shared services model and participation in group-wide policies". 

But then, as noted in my Leviathan post, Councillors would likely find themselves out-thought and out-witted by the managers they employ through their CEO. Hiding to nothing maybe.

Blunt weapon would be a capped annual budget for each CCO and require them to cut the coat to suit the cloth rather than create all these soft jobs for boys and the girls who do little more than gossip and watch each other's tails, generating more heat than light, and leading to less productive investment on the ground.

Thursday, December 15, 2016

Costly Council Apron Strings

Here I am standing at the end of my Devonport street. I'm on the "apron" of the "T-intersection". It was relaid in hot mix by Council contractors about a month ago. Maintenance I guess.Took them several days. Between 10 and 15 high-vis clothed men on site. Lots of technology. Utes and about a hundred witches hats.

I'd driven over it for a few years and hadn't seen any problem with it. But I've learned that's often the case.

That's not my beef here.


These cones are still outside my front gate. I have phoned Council's hotline. They assure me they will be taken away in 10 working days. So it's likely they'll be gone by Christmas. They make the street a bit Christmasy though don't you think?

That's not my beef here either. (Nor is it with my neighbour across the street  hard at work, or his cat, or with the boat - this is Devonport after all.)
Between 1998 and 2004 I was Chair/Deputy Chair of North Shore City Council's Works and Environment Committee, and also on the Devonport Community Board. Street maintenance works like this apron were routinely done then too. A wise councillor told me then that anything the council did - road maintenance, mowing of lawns, sewer pipe repairs for example - would cost double what it would cost done by the private sector. Over time I came to understand why that was.

Public money and public assets on public land are different beasts to manage compared with what happens on private land with private infrastructure. There is consultation with local residents about timing, there is a need for annual budget planning that has to be consulted and agreed, and then, there was even consultation about whether the apron would be done in hot mix or chip seal.

But it's different again, and far more costly today, and you won't see an elected representative anywhere near the work. They are not involved anymore. They don't know what's happening in the urban environment where they have been elected to represent community interests. They're not there to watch over the wise use of ratepayer funds.

Council amalgamation and remote, arms length Council Controlled Organisations, are all part of the regional institutional change that is at the root of what is leading major local cultural change.

In the bad old days there were several "small contractors" who did this sort of road maintenance. Locally based operations, overseen by a local Council area manager. Usually the road section would be closed while it happened. Notices would advise of this, and residents would take slightly longer to get from "A" to "B". So there was no need for hundred of witches hats - but more importantly - there was no need for several men to be paid to direct the desultory traffic movements that happen in the back-blocks of Devonport. It was much cheaper.

I can hear the moans and complaints this posting will cause in AT (Auckland Transport) from here. They will say the work is being done to a higher standard. They will say that Devonport residents are being less disturbed by the work. They will say there are fewer safety risks. And most of that might be true. But that isn't the issue.

Not everybody is interested in the maintenance of their pipes, roads, libraries and parks. But you'd be surprised how many are. (One of my long standing memories visiting my daughter in Sapporo Japan, was to see that road works and pipe works were done by local pensioners and neighbours chatted with them on the way to the shops.) There is just a little more alienation of community involvement that happens when shared assets are maintained and managed remotely. A little more atomisation and separation. An emphasis on private lives. A loss of opportunity for community engagement. And at increased cost as well! Talk about a lose-lose outcome.

We are steadily losing through amalgamation parts of the institutional fabric that I associate with life and social development in New Zealand towns - socially connected urban communities.

Running On Empty

A few weeks ago I did the Alps to Oamaru cycle adventure, on part of John Key’s legacy cycleway infrastructure network. Rightly praised and highly popular. You can see a GoPro video I made about it here.

The best part was from Mt Cook to Lake Waitaki – through the McKenzie Country. But the rest of it is a downhill experience as the effects of another one of John Key’s legacy projects gets up your nose.

Intensive dairy farming enabled by central government assisted and encouraged irrigation, more than gets up your nose though. Through Kurow, Duntroon and Ngapara we cycled through cow pats and sheep manure and gear shift mechanisms got so clogged I had to poke the shit off.

Being an Oamaru boy, at Waikaki Boys High School, this landscape was my backyard. And later when I attended Canterbury University, my backyard extended to include much of the Canterbury Plains.

We had a family crib (bach) at Gemmell’s Crossing on the Kakanui River 8 miles from home. Even in the hottest summer you could jump off the bridge, or a willow tree rope swing. The river was deep, wide, clear, fast-flowing and glorious. Dad was a keen fly-fisherman.

Now it’s buggered.

Too much water being taken out of it, and from bores sucking down its feeder aquifers. For irrigation.

The soils that have naturally developed in the normally semi-arid climate (600mm of rain in an average year) don’t hold much water. Any extra goes through, some runs off on the underlying clays, some into the water table, and the rest into aquifers. That was when it did rain. Now centrally-pivoting irrigators have taken over. Inevitably, to get the grass growth needed, much of the land is over-irrigated.

So now any dissolved nitrates or any other chemicals or fertilisers, get washed into the river or into the aquifers. It’s not rain anymore that wets the ground and replenishes the groundwaters. It’s irrigation. And it’s washing through what clogged up my bike gears. Which is why what water we do see today in the Kakanui is green and weed-filled. Most people in New Zealand don’t know about the Kakanui River. More know about what’s happening to rivers in the Canterbury Plains.

Here’s some remarkable photo essays that Stuff has run recently on Canterbury’s braided Ashley and Selwyn Rivers.Community Mourns its Lost River; Selwyn is polluted and running dry; Trout get free ride to deeper water; 60% drop in river flow.

I talked to a Fish and Game Executive member about what’s happening. He’s angry of course. One thing he told me explains attitudes.

Apparently New Zealand’s Primary Industries Minister was in South Canterbury, talking to farmers. His memorable quote, when he talked about the rivers?

“Every drop that gets to the sea is water wasted….”

That’s the attitude of most - but not all - farmers. Seems to be the attitude of government Ministers.

The Minister of Environment writes: “good science and not slogans are at the heart of decision-making…” He’s grumpy at Fish and Game. He argues: “making every river swimmable is ‘not practical’…” And on Hastings and Havelock North: there’s “…’no evidence’ of dairy linked to gastro…”

Yet these are ministers in a government that sacked ECan Regional Councillors who, under advice from their water quality scientists, moved to restrict water-take permits in Canterbury for more dairy farming because of modelled nitrate pollution risks.

Seems like there’s science we like, and science we don’t.

Did you know that Fonterra gives itself a GST holiday on a proportion of the milk it buys from cooperative farmers? Payments for that milk are treated instead as a dividend and don’t generate GST revenues for central government. This is a subsidy to Fonterra farmers.

Nevertheless, in terms of central government revenues, Fonterra’s annual turnover (2015 year) of $18.8 bn (equivalent to almost a third of NZ government’s annual tax revenues) resulted in around $500 million in total tax payments (compare - by the way - with the $2.8bn GST collected annually from tourists). However these fiscal numbers don’t account for the total cost to New Zealand, or to the rest of the world for that matter, of the focus our country has on dairy farming.

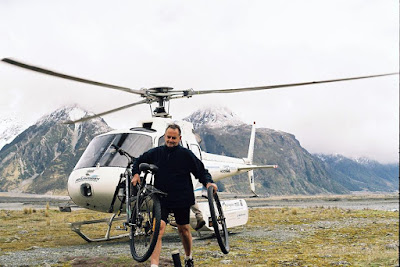
Action photo of me at start of A2O taken by Emily Cayford

If you looked at my A2O video you will have seen the quality and clarity of rivers in Central Otago close to their source. Hard to value the losses that are being caused by dairy intensification.

The bald Fonterra numbers exclude or conceal externalities - external costs such as:
  • Loss of fresh water area and amenity for local population recreation (swimming, boating and fishing) 
  • Loss of biomass and diversity of freshwater ecosystems (eels and trout are at the end of a complex food-chain) 
  • Loss of cultural and geographical landscapes for regional parks, tourist attractions, and which are reminders of what physically shaped our human history and character
  • Loss of future tourist revenues - who wants to look at or bike through dairy factory farming?
  • Loss of dry-weather resilience because of reduced water volumes stored in underground aquifers 
  • Loss of global economic resilience because of focus and reliance on mono-culture agriculture 
  • Loss of rainforest land in Malaysia and Indonesia. Over 1.5 million hectares of palm plantations were planted to meet typical annual New Zealand imports of Palm Kernel processing products to supplement the pasture feed of the country’s dairy herd (2008 data). 
 (By the way, for a few Dairy facts and figures.)

Whose water is it anyway – especially the underground water? And whose landscape is it – particularly outstanding landscapes that intensive irrigation will change forever?

This is not a natural disturbance. Like an earthquake.

It is a disturbance borne of short-term economic planning which is slowly destroying what could be termed a kiwi birthright, core kiwi values, the essence of New Zealand. The institutions that enable this disturbance know their economic livelihoods, and of everyone who works for them, depend on the disturbance continuing, and understand it is part of their role to minimize and dismiss and deflect concern and criticism.

Fonterra, Dairy New Zealand, and Government Ministers all share this responsibility.

How long will New Zealanders let them get away with it – that is the question?

(Stop Press: Some are doing something about this now. You can read a useful article about what's happening in the McKenzie country in the current issue of the Listener magazine. And EDS - Environmental Defence Society - is mounting a legal challenge to the irrigation and land use changes that are happening. They are in court this month and need financial support. EDS were successful in a similar King Salmon challenge relating to aquaculture in the Marlborough Sounds. They are an effective organisation. I suggest you make a donation. Go here.)

Leviathan Part 1: Auckland

A different analysis of the social, political, economic and cultural forces shaping the western world is emerging post the 2008 "Global Financial Crisis" - a crisis which many have interpreted as the sign of a major cross-road in the progress of the neo-liberal project that economic efficiency requires a free market. This different analysis was developing in the USA before neo-liberalism really took off under Reagan, was dormant for a time, but is now coming back into focus to help explain Trump, Brexit and other similar behaviours and outcomes. Important writers include Galbraith, Weber, James Burnham, Samuel T. Francis and Jerry Woodruff. Hardly household names. Especially not here in New Zealand.

To kick this post off, a summary of the analysis is this: a new ruling social group has been developing over the past fifty years in the West. This is an increasingly powerful class of skilled professionals who are at the heart of and who guide the operations of an expansion of government power and bureaucracy, and the widespread emergence of mass organisations. It is argued that this is a change from times when a greater proportion of government and public functions were de-centralised, smaller and local, and where more economic activity was concentrated in the hands of private entrepreneurs, their families, and local communities.

It is argued that this increasingly influential and affluent social grouping has emerged as a managerial elite which is steadily displacing social and political institutions that had existed to reinforce and protect the interests of the large group of society who now feel increasingly alienated and by-passed. This managerial elite is remaking society by substituting its new world outlook.

But I get ahead of myself with such a summary. In this post I would like to briefly explore what this analysis has to say about Auckland today - especially since amalgamation - and the creation of a mass organisation (Auckland Council) whose form, function and behaviour, is so well analysed and anticipated.

Mass Organisation and Loss of Owner (Ratepayer) Control 

It is useful to note that the writers listed above are not easily dismissed as "left" or "right" in their views. So don't be put off by the fact that the early pages of texts examining the social changes I discuss here usually begin with a bit of Karl Marx and Adam Smith. For example, Samuel Francis writes:
Both Smith and Marx, contemplating the rudimentary forms of corporations of their time, perceived a natural conflict of interest between the owners or stockholders of a corporation and its managers. The owners are interested primarily in a profitable return on their investment, measured in the increased yield in their dividend. The managers, on the other hand, are interested in the wellbeing and particularly in the growth of the corporation itself, and they typically desire not to pay out higher yields to the owners but to reinvest corporate profits in an increased capacity for greater output and enlargement of facilities and operations. (Pg 22, Leviathan and its Enemies, Samuel T Francis)  

For "owner and stockholder" read "ratepayer", for "corporation" read "council", for "return on investment" read "minimise rates for essential public services".

In this next section, quoted from a few pages later, as Francis develops his argument, I have only swapped "Council" for "corporation", and "ratepayer" for "owner". You will get the picture:
...the dispersion of the mass of ratepayers, who lack the opportunity, the interest, or the ability to coordinate their voting power, tends to prevent most effective challenges to those who possess the skills to operate and direct the Council. But the decisive cause of the loss of control by the ratepayers to the managers is the sheer size, complexity, and technicality of the mass organisation and its activities. Whatever the legal rights of ratepayers.... they cannot... acquire the specialised technical skills that management of the mass organisation involves...(Pg 25, Leviathan and its Enemies, Samuel T Francis)

And here we could just as easily substitute "elected councillors" for "ratepayers", because councillors are the ratepayers' representatives in "control" of Auckland Council. The main thrust of this analysis is the problem presented to ratepayers and their representatives in any attempt to challenge or to control Auckland Council. Frances continues (and no swapping is needed):
Like the corporation, the mass state undertakes a wide range of diverse and highly technical activities in the economy, society, science and communications, in addition to its purely administrative and political functions. The latter also become increasingly specialised, technical and complex to the point where today academic degrees and entire schools of public administration exist and flourish.... in the state sector of mass society and in the mass corporation, actual power is distributed according to managerial skills and not by a formal equality of rights and votes or by legal ownership.  (Pg 45 and 47, Leviathan and its Enemies, Samuel T Francis) 
Another plank in the analysis is the relationship that exists between the mass state organisation and large private corporations. The myth of public and private separation is well and truly dismissed:
Mass organisations in the economy cannot operate - they cannot plan for mass production, financing, research, and marketing - without the cooperation of the state, and this cooperation serves the interests of the managerial elite in the state, since its role in the economy extends its power and functions. Thus the managerial elites of the mass corporations and the mass state do not resist, and, indeed, collaborate to promote, the fusion of the mass economy and the mass state.  (Pg 63, Leviathan and its Enemies, Samuel T Francis)

Nowhere do we see the truth of this more clearly than what is happening here in Auckland between the growth economy and Auckland Council with population growth and mass housing development, and where the "owners" of Auckland - existing ratepayers - have no control of their own environment, let alone Council managers in charge of enabling and facilitating this social transformation. (I suggest it is also evident between central government and the Fonterra Corporation; and between the emergency state in Christchurch and Fletcher Corporation - but those are other stories.)

I'll end this post with a brief account of another conceptual idea that is explored in this analysis of the massing of western society, and which is relevant to Auckland because of its size and growth. Mass state organisations (and mass corporations) act to break down social differentiations that impede or restrict mass production and mass consumption. A clear example of this in Auckland has been the replacement of a set of diverse District Plans, with a single Unitary Plan which envisages just 3 or 4 types of urban housing settlement. The main advocates for this simplification were from the property development economy. For them the diversity in planning across Auckland and the different housing and street typologies that have resulted in Devonport, Ponsonby, Waitakere, Albany, Freemans Bay, Flat Bush and Parnell for example, was intolerable. A more homogeneous system of urban planning was required. Distinct and local Community Board arms of the state were also intolerable, when viewed from the perspective of the professional management class, whose sophisticated and highly educated submissions easily trumped the local interest arguments mounted by those clinging to community and a particular and kiwi way of life.

The question then. Are you part of the problem, or part of the solution?

A High Sea in Auckland

This year I gave students a lecture about sea level and storm surge plannning in New Zealand. This was partly informed by the Parliamentary Commissioner for Environment's report Rising Seas: Certainty and Uncertainty. It was also informed by the recent South Dunedin flooding incident, and a lesser known one that affected Auckland on a fine Sunday, 23 January 2011.

At the time I took a few pictures in Devonport, and did a post about it.

The urban policy course provided an opportunity to talk with students about the various factors in play that day that caused the kind of coastal inundation recorded in the photos. Students explored various datasets, most of which are readily available.

First off all they checked out weatheronline for rainfall. It's available there for free for Auckland Airport. You can see that it did rain on the 23rd of January - but not a lot - about 15mm. It rained much more heavily around the 28th January, but there was no coastal flooding.
You can find this comprehensive weather information from timeanddate.com. At the bottom are the wind speeds and directions. Unusually the winds are strong South Easterlies until mid-day, around 33 kph. They would have been blowing straight up Waitemata Harbour (but they were also doing that the day before).
This one also come from weatheronline. It shows the atmospheric air pressure over Auckland. You can see that on the Sunday in question it dropped to 995 hectopascals. That's quite low, and has the effect of lifting sea levels, because higher pressures elsewhere push the sea down there, pushing it up where air pressure is lower.
And this is the really interesting graph students wre able to produce from Ports of Auckland tidal charts provided by POAL for the purpose of this course. This graph shows the sea levels at POAL wharves in Waitemata Harbour for the month of January, 2011. There are two high tides (and two low tides) each 24 hours. The sea level recorded at 23rd January is 4.129 metres - and you can see that the "normal" tidal level around that time was about 3.6 metres - a typical peak high tide level in a month.

Thus the sea level in Auckland's Waitemata Harbour was half a metre higher than normal on the 23rd of January 2011. What was the main cause?

Was it the rainfall? If you look at the rainfall graph you will note that heavy rain fell on the 28th January, but the sea level on the 28th January (counting 10 peaks after 23rd January peak) was only 3.1 metres. So, almost certainly not.

Was it the wind? There were strong winds the day before - but not as strong. So the wind would certainly have contributed, by pushing the sea up Waitemata Harbour.

Was it low air pressure? Check out the PCE's report for the physics of this. That report confirms the direct relationship that exists between low air pressure, and elevated sea levels. Often called a "storm surge". This is the name given to elevated sea levels in a storm where winds circulate around an area of low air pressure.

Big storms are associated with very low air pressure, and very elevated sea levels. Hurricane Katrina elevated the sea level at New Orleans by 7 metres. Hurricane Sandy elevated the sea level at New York by 2 metres. The storm that sunk the Wahine in 1968 was recorded as a low pressure weather system of 970 hectopascals (the lowest recorded around NZ) which elevated the sea level at Ports of Tauranga by 88 centimetres and caused widespread coastal flooding - quite apart from sinking the Wahine.

Tropical storm systems are moving further and further south with climate change, and the frequency of their arrival offshore of New Zealand is increasing. It is only a matter of time before air pressure and winds combine to increase the sea level in Auckland's Waitemata Harbour a metre above normal high tide.
Are we ready, what's the plan, and how much warning would we have?

How Fast are Tsunami Waves?

Like with earthquakes, despite being a physics nerd, it wasn’t until one happened where I lived, that I got interested in them, and wanted to understand them.

For example, let’s just say there had been a big shake 20 kilometres offshore from Kaikoura*. One that caused a chunky land uplift deep under the sea. How long would it take for the resulting tsunami wave to reach the coast if the depth of water was 1500 feet on average (500 metres)?

The physics is well understood. A tsunami wave is not like a surface wave caused by wind. It gets its energy because of the enormous pressures that exist deep under the sea. 

Tsunami wave speed = Square root (Water depth x Gravity)
                                = Sqrt (500 x 10)   (Gravity is more accurately 9.8 metres/second/second.)
                                = Sqrt (5000)   (approx)
                                = 70 metres/second    (approx)
                               = 250 kilometres/hour.   (roughly - the deeper the water, the faster the wave)

So it would take the first tsunami wave less than 5 minutes to hit the Kaikoura shoreline.  (In an earthquake there are usually several waves produced **). 5 minutes is a very short time, and if the average depth was 1000 metres the wave would take just over 3 minutes to hit.

That’s why it’s important to get tsunami warning systems right.

Otherwise they are useless.

* The Kaikoura Canyon is a submarine canyon situated 500 metres off the coast to the south-east of the Kaikoura peninsula. It is 60 km long, up to 1200 m deep, and is generally U-shaped. It is an active canyon that merges into a deep-ocean channel system that meanders for hundreds of kilometres across the deep ocean floor.
** You will have seen video footage of tsunami, and seen that they don't come ashore at anything like 250 kph. In fact they come ashore at more like 20 to 30 kph. So what happens? As the sea depth close to land gets shallower, tsunami waves that have been travelling at 100s of kilometres/hour and a hundred kilometres peak to peak only a metre high, get higher and closer and slower, as the energy of the deep water gets pushed up by the sloping sea floor. This is termed the "run up" phase.     

What happened at Fukishima, Japan? 

On March 11, 2011, at 2:46 p.m. local time (05:46 Universal Time, or UTC), a magnitude 9.0 earthquake struck off the east coast of Japan. The epicenter was 130 kilometers (80 miles) east of the inland city of Sendai, and 373 kilometers (231 miles) northeast of Tokyo. The earthquake took place around 67 km (42 mi) from the nearest point on Japan's coastline, and initial estimates indicated the tsunami would have taken 10 to 30 minutes to reach the areas first affected, and then areas farther north and south based on the geography of the coastline.

According to the Japan Meteorological Agency there were only about 4 minutes between the earthquake and the initial tsunami arrival at the observation buoy just off the coast of Kamaishi. Assuming the estimated arrival time is correct (i.e. it took another 5 minutes for the wave to travel from the buoy to the coast) that would give them somewhere between 9 to 24 minutes between the earthquake and the arrival of the first tsunami at the closest points and various points north and south.

One minute before the earthquake was felt in Tokyo, Japan’s Earthquake Early Warning system, which includes more than 1,000 seismometers, sent out warnings of impending strong shaking to millions. It is believed that the early warning by the Japan Meteorological Agency (JMA) saved many lives. The warning for the general public was delivered about 8 seconds after the first P wave was detected, or about 31 seconds after the earthquake occurred.

Assuming that the earthquake time reported is the time at which the JMA became aware that there was an earthquake occurring (most likely/logical time to report in my opinion), taking into consideration that it takes them at least 3 minutes to issue a forecast AND assuming that this time is when people in the affected areas actually receive the tsunami warning, it leaves only 6 to 21 minutes for people to register the warning, to take action, and to get to high ground. And that was for an earthquake that occurred 67 kilometres offshore.

If New Zealand had its act together in the same way Japan did - ie 3 minutes to figure out what was happening, decide, and issue a warning to the Kaikoura sirens - and if the first wave hit in between 3 and 5 minutes.... well, go figure...


This gives the heights of tsunami recorded around Japan's coastline. Dark red and bright red mark the highest waves, and the closest points to the epicentre.

And for some of those locations, here are the timings of arrival of the biggest tsunami waves, after the actual earthquake that triggered them:

On 13 March 2011, the Japan Meteorological Agency (JMA) published details of tsunami observations recorded around the coastline of Japan following the earthquake. These observations included tsunami maximum readings of over 3 m (9.8 ft) at the following locations and times on 11 March 2011, following the earthquake which remember was at 14:46 JST:

• 15:12 JST – off Kamaishi – 6.8 m (22 ft)   - (ie 26 minutes later with epicentre 67 kilometres away)
• 15:15 JST – Ōfunato – 3.2 m (10 ft) or higher
• 15:20 JST – Ishinomaki-shi Ayukawa – 3.3 m (11 ft) or higher
• 15:21 JST – Miyako – 4.0 m (13.1 ft) or higher
• 15:21 JST – Kamaishi – 4.1 m (13 ft) or higher
• 15:44 JST – Erimo-cho Shoya – 3.5 m (11 ft)
• 15:50 JST – Sōma – 7.3 m (24 ft) or higher
• 16:52 JST – Ōarai – 4.2 m (14 ft)

While the kiwi tsunami message of “If it’s long and strong, get gone” is a good one, we need to better educate our population and civil emergency people about what can happen, and we need better systems in place that the public can trust.

For example, I am aware that people living at Mangawhai Heads, at the top of the North Island, more than 10 metres above mean high water and more than 100 metres inland from the estuary, were woken by volunteers and told to move to higher ground after the Kaikoura earthquake which had occurred just after mid-night. They hadn’t heard the alarm either.

Otherwise it’s a bit like crying “wolf”.

New Broom at Auckland Council?

I was going to head this post "the first 100 days" (since the election on 8 October 2016) but that won't be until mid January. There have been some good signs - powerful calls for a regional fuel tax; a tourist levy; ATEED told to pull back from boxing promotion; no more wharf / port extensions; silence on a new city slogan. Good stuff.

However. The elephant in Auckland's room continues to be Auckland Council itself.

It keeps on growing.

Getting bigger. Employing more and more highly paid professionals. Consuming more and more resources in existing and accommodating its ever-expanding self, eating further into rate-payer dollars, becoming even less productive when measured against outcomes that matter to Auckland's residents.

The recent review of CCO (Council Controlled Organisation) letters of expectation presented one of the few opportunities that exist to councillors to reduce operating costs, and to begin reversing the growth of the elephant. Before reading on have a quick read of another of today's postings: "Levithan Part 1: Auckland" - which is the start of an analysis of mass organisation culture in New Zealand. An upcoming post will examine the relationship between Auckland Council's growth, Auckland City's population growth, immigration growth, and central government economic growth plans - and the inter-dependencies.

The Council report (to Tuesday's meeting - 13 December) that introduces the letters of expectation to CCO Chief Executive and their Boards tells Councillors this:
General messages for 2017-2018 
As council moves into the third term since amalgamation, there is a need to reset some of the expectations on the CCOs about their participation and commitment to a whole – of – group approach. This year’s draft LOEs therefore outline a number of general expectations, and send a strong signal that Council will be giving significantly more attention to the degree to which CCOs are delivering outcomes for Aucklanders. These expectations are set out below.
• CCOs need to take active steps to reinforce accountability to council. This will require strong leadership from Boards and chief executives, to build cultures and behaviours which recognise their organisations’ responsibilities to residents and ratepayers. Greater transparency in financial reporting is an important element of this. Additionally, CCOs need to work with council to develop new performance metrics which genuinely measure our success in achieving outcomes.
• CCOs need to align their operations with council strategies. A key plank of this is participation in development of the refreshed Auckland Plan.
• A stronger sense of collaboration in the council group is needed. This means collaborating across the other CCOs, and with council itself, to achieve group outcomes, and to maximise investment opportunities. As part of this, the shared services model and participation in group - wide policies remains important.
• CCOs should develop a stronger focus on customer service. One aspect of this is engaging more actively with Local Boards.

None of these expectations discusses the need to reduce spend, economise, to prioritise expenditure on infrastructure investments and maintainance ("outcomes" are not defined or differentiated). What these expectations do describe though, and require, are just the sorts of activities and tasks that professional middle managers love and can make a real meal of, and grow the elephant.

For example: "take active steps to reinforce accountability to Council". That means more internally focussed professionals, bean-counting, writing reports, being audited and checked. It also means more staff employed by CCOs to monitor goings-on-at-Council, checking the grape-vine, snooping at the rumour-mill, finding out who's saying what, and plotting and advising how to fix it. None of this is productive (as far as ratepayers are concerned) but it is deeply rewarding work for many professional managers (they love it). And in the same sentence being asked to "build cultures and behaviours". Man. What a great job that will be for highly qualified Business Administration experts and others with similar degrees and experience. And then there's "develop new performance metrics". Again, the science of mass organisation managerialism is summoned. How big a team will be required for this? And how much overseas consulting will be required? These are great jobs if you can get them. Look great on the CV. Passport to a senior role in MBIE I'm sure.

One that really tickles me is that "a stronger sense of collaboration in the council group is needed". Fat chance. The CCOs are at war with each other for the affections of Councillors and Council. Very senior managers spend a good chunk of their time in relationship management - but not relationships with "customers" - they are far more concerned about relationships with family members. Because it's all about affection, keeping in good with Council's CEO, not rocking the boat even fractionally with a noisy councillor, and at all times keeping heads below the parapet until you've got a really good story to crow about.

Which brings me to a CCO output that deserves as much attention as the proposed new Auckland slogan. Every CCO has a public relations and public affairs and public communications and relationship management function/team/office/budget. How about centralising that function Mr Mayor and Councillors. That would result in fewer highly paid communications managers, reduce costs in an area that is embarrassingly over-resourced and capable of inter-group conflict, and would be a positive way of implementing the expectation of a "shared services model and participation in group-wide policies". 

But then, as noted in my Leviathan post, Councillors would likely find themselves out-thought and out-witted by the managers they employ through their CEO. Hiding to nothing maybe.

Blunt weapon would be a capped annual budget for each CCO and require them to cut the coat to suit the cloth rather than create all these soft jobs for boys and the girls who do little more than gossip and watch each other's tails, generating more heat than light, and leading to less productive investment on the ground.